Measure How We See – The Way to Perfect Display Colors
Sometimes different displays, especially when they use different technologies and exhibit a wide color gamut, might not look similar after the calibration – even when using the most accurate spectrometers or colorimeters. This white paper explains the underlying principles of display colorimetry and introduces different possible solutions to solve or minimize that problem.
We will take you on the journey how color metrology was developed and shed some light on the purpose of the so called “standard observer”. You might already know the CIE 1931 or CIE 170:2015 observer. Those are models to describe the average human color perception. It is the main building block and the basis of any color metrology and automated color‑matching. However, individual observer differences and viewing conditions pose challenges. We will learn that addressing these challenges is crucial for achieving perfect display colors.
From color perception to color measurement
Did you ever think about being able to measure color is kind of strange? Why? Because color is a perception. It is not self-explaining that we can measure color, because color is not a physical quantity as such. We can measure the spectrum falling into our eyes, which is a major contributor to the color we see, but the spectrum as such is not the color. The interaction of the spectral stimulus, how our eye functions and finally the processing happening in our brain leads to the color we perceive. Also we can not directly conclude how another person sees a color, we only know how we see a color ourselves. Therefore to describe colors in a quantitative way a system needed to be developed. This system makes use of the fact that we can tell when two colors look the same to us and finally leads to the color-matching functions (CMF). They describe the color perception of a human observer and can be standardized. The CMFs represent our human color vision in a mathematical way. This allows us to calculate with color values and compare those.
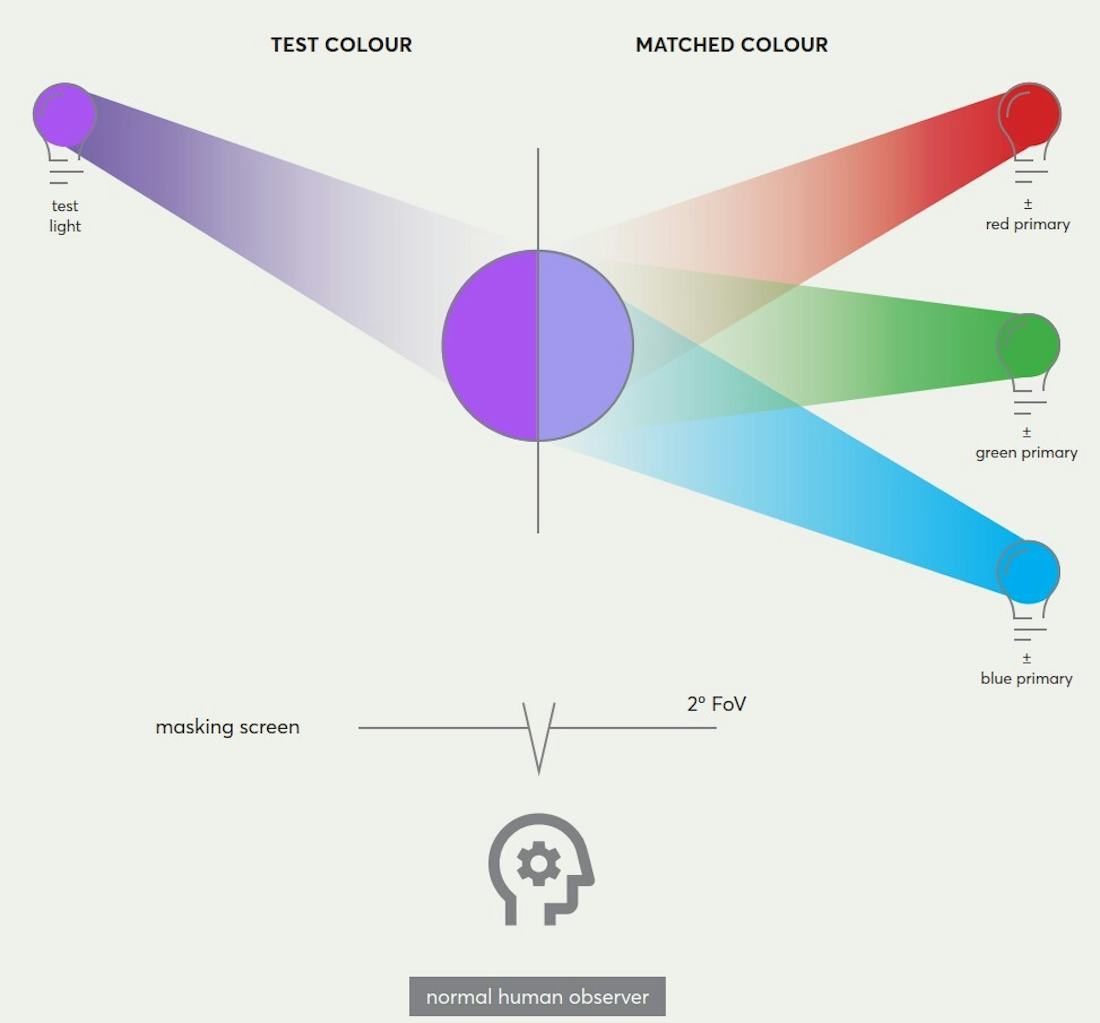
1929 and 1931 marks the beginning of the color-matching functions. The two color scientists, Wright and Guild, carried out two psychological experiments, where the mixture of three colored lights needed to be matched to a test stimuli (color),displayed adjacent to it. This was repeated for several different test stimuli/colors (see the illustration below). The basic idea behind that experiment is that for a given set of three well-defined light sources the ratio of the intensity of these light sources describes a specific color. In this article we will not discuss the properties of these light sources and why they were chosen. When you want to dive deeper into this topic we have linked some interesting articles at the end of the article.
It is well important to note that only three light sources are sufficient to be used in that experiment, because the cones in our eye are sensitive in three distinct wavelength regions. It is also important to know that the mentioned color-matching experiment can successfully be carried out with different sets of three primary lights. When two sets of primary light sources are known, it is also possible to transfer the ratio values of the three used light sources – now we will call them with the correct name, the color tristimulus values – to the tristimulus values of another set of primaries. You can think of it as transferring cm to inch or vice versa. Although tristimulus values do not have a unit, because they are ratios. But of course, you will need to know for which set of primaries the tristimulus values are given. We will come back to that need in a minute.
How the viewing angle influences the color we see
Before we do so, we will have a look at the retina of our eye. The human eye has three different types of cones that are responsible for color vision. These cone types are:
- S-cones (short-wavelength cones):- Most sensitive to short-wavelength light, which is in the blue-violet part of the spectrum
- M-cones (medium-wavelength cones): Most sensitive to medium-wavelength light, which is in the green-yellow part of the spectrum.
- L-cones (long-wavelength cones): Most sensitive to long-wavelength light, which is in the red-orange part of the spectrum.
The following picture illustrates the cone cell distribution in the fovea, the center part of the retina. Only in this area we can see fine details and distinguish colors.
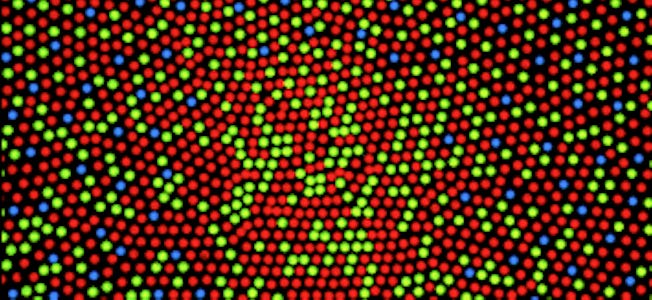
The three cone types are not evenly distributed in the fovea. In the central part of the fovea are only M- and L-cones. While in the outer parts of the fovea the density of S‑cones increases. As a consequence of our anatomy we therefore perceive colors differently, depending on the viewing field. So when conducting a color-matching experiment it is vital to take the viewing angle into account. In 1931 the CIE published the color-matching functions for the 2° standard observer:
“Color-matching functions are essential tools in color science to quantify how humans perceive color.“
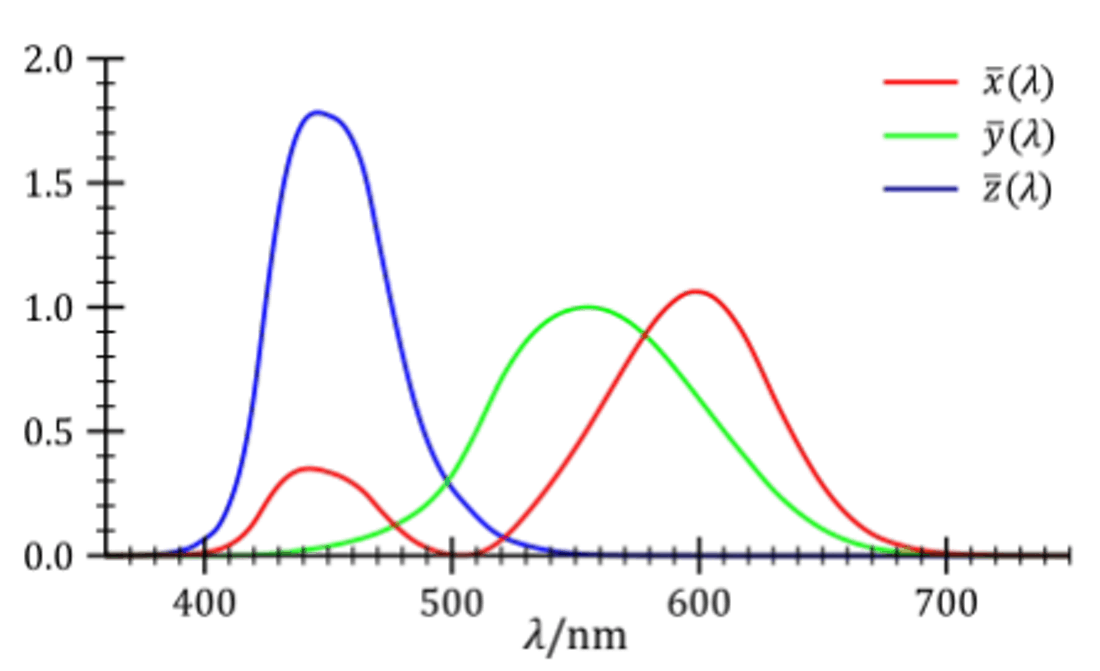
Color-matching functions are essential tools in color science to quantify how humans perceive color. These functions describe how the eye responds to different wavelengths of light. They are needed for measurement-based accurate color reproduction in various applications.
With those, the tristimulus color values X, Y and Z can be calculated for any given spectrum. The Admesy Prometheus Software Suite uses this approach for spectral measurements with the Prometheus Viewfinder Spectrometer. Another option is to measure the tristimulus color values directly with a colorimeter, which implements the CIE 1931 2° CMFs in three or four filters. The Admesy Prometheus colorimeters follow that approach. An advantage of using a spectrometer is the ability to calculate color tristimulus values also for different viewing conditions (different field sizes), represented by different CMFs. On the other hand a colorimeter has the advantage of allowing faster measurements compared to the spectroradiometer, due to the light energy being distributed over just three channels, instead of many more channels.
Summary — Color-matching functions are the basis to describe the human color vision
Before we explain the reason why several CMFs have been developed, we want to summarize and extend on what we have learned so far.
- By conducting a color-matching experiment it is possible to quantify the human color vision. Based on that, color measurements can be carried out by instruments.
- The set of primaries used for the color-matching experiment needs to be characterized and reported. To be able to compare color values this set of primaries is standardized.
- The set of primaries chosen to define the CIE 1931 2° observer CMFs are virtual primaries which have been calculated from the set of physical primaries. That was done for practical reasons, one of them making calculations easier, which in 1931 needed to be done without computational help.
- The viewing conditions for the color-matching experiment needs to be reported. One major parameter being the viewing angle (field size) under which the test stimulus color is appraised.
In addition to the viewing angle further parameters have an influence about when a visual color match is achieved, because of the complex “image‑processing” happening in our brain. A major parameter to the human vision is the adaptation state, by adjusting to the current illumination and allowing us to preserve the appearance of object colors. For display applications one will often be in a mixed adaptation state, which is hard to fully specify. Another parameter for example is the absolute luminance level, which is correlated to the brightness we perceive. But also the surround and background of the color stimuli presented has an influence on our color perception. A famous example of the influence of the surround of a color patch is the simultaneous contrast, where the same spectral stimulus will be perceived as somewhat different colors, depending on the surrounding colors.

So in a strict sense any color tristimulus value will only be valid for a specific viewing condition. For other viewing conditions another set of tristimulus values would be needed to describe a visual color-match. Because there is an infinite number of possible viewing conditions, that would imply that an infinite number of color‑matching functions would be needed. That is of course not practical. And it would also mean that one could not compare color values from different viewing conditions directly. Luckily the implications of different viewing conditions will most often not result in drastically different perceived colors. So as an approximation it is fine for most practical applications to use the tristimulus color values for the CIE 1931 2° observer. But one has to be aware that for the stated reasons two displays which are adjusted to measure the same XYZ tristimulus color values can still look different. In many cases the differences will be relatively small, but for some cases the visual differences can become larger. The two main contributors for possible visual color differences are the viewing angle we already discussed, but in addition also the variation of the color vision of different observers.
Observer metamerism is when under the same viewing conditions, two uniform patches displayed on two screens may look alike to one viewer but different to another. This is caused by variations in color matching functions unique to each individual.
Discussion of the CIE 1931 2°, CIE 1964 10° and CIE 170-2:2015 2° and 10° observers
As we have explained the viewing angle has an influence on the color we see. For practical applications it is mostly sufficient to describe two different viewing angles with the color-matching functions. In addition to the CIE 1931 2° standard observer, the CIE introduced a second standard observer in 1964 describing the color perception under a 10° viewing angle.
2° and 10° observers
For all applications where relatively small colored details are appraised the 2° observer can be used for all viewing angles up to 4°. A rule of thumb is that the width of the thumbnail – when the arm is extended – is about 2°.
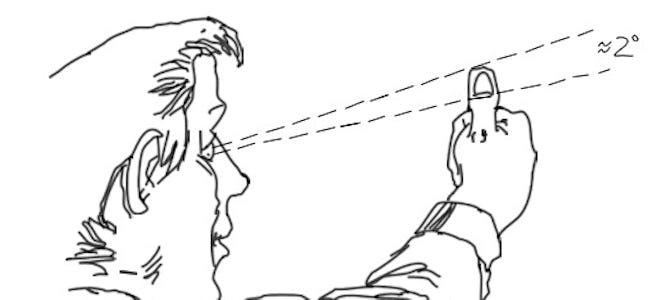
For viewing angles larger than 4° the visual color differences warrant an additional observer and set of color-matching functions. The CIE 1964 10° observer standardizes this viewing condition.
Now the practical question arises which standard observer to choose for display applications? One could think that the 10° observer would be the better choice, because a display will in most cases be viewed under an angle which is larger than 4°. But when we remember that the viewing angle of the color stimuli as such is determining, we find that the 2° observer can be the closer fit, for example when we view a photo with detailed elements. For that reason the ICDM, the International Committee for Display Metrology, part of SID’s Definitions and Standards Committee, bases all display metrology on the CIE 1931 2° color-matching functions [Chapter 21.2.2, IDMS version 1.2].
When two displays are calibrated to the same tristimulus color values and then visually compared, this is often done by displaying full-screen white. In this case it is not surprising that a calibration based on the CIE 1964 10° observer can result in a better visual match. But that does not mean that the CIE 1964 10° observer would be “better” than the CIE 1931 2° observer. The two standard observers just serve a different purpose / use case. It is therefore not correct to state the 10° observer being superior to the 2° observer, which is sometimes falsely done. The 10° observer is newer than the 2° observer and methods had improved over the years indeed, but the relevant change is the larger viewing angle condition the 10° CMFs describe.
Even when it is known that the CIE 1931 observer has its problems in the short wavelength region, a change of the standard needs to be significant, otherwise the downsides of introducing a new standard can outweigh the potential gains. Besides the potential huge costs implied by a new standard, for example to buy new or update existing instrumentation, another disadvantage would be not to be able to compare old and new data. Therefore the CIE decided in 1964 not to change the 2° observer, because the existing data was not deemed large enough to warrant a change in the standard for practical colorimetry.
The CIE 170 color-matching functions and observer metamerism
So far in our journey into the history of colorimetry, we now understand that the standard observer can describe the color perception of an average observer, but does not take into account the variability between different observers. Like different people will show anatomical variability in height, weight and other body features, also the optical properties of the eye will vary in the population. Those optical properties of the eye are a function of the field size (viewing angle), but also of the age of a person. But even in the same age group the optical density of the lens and the macular pigment may differ (the fovea is part of the macula, the center part of the retina). For some applications this so-called observer metamerism can pose challenges and research is still going on in that area.
Vision researchers felt the need for an improved colorimetric observer as a common basis for their fundamental research. In 2006 the CIE published part 1 of the technical report 170 and part 2 in 2015. It introduces the best modern estimates of the spectral sensitivities of the three cone types. This describes the initial response to the light by the cones and needs to be precisely known to accurately specify a color stimulus from a given spectral power distribution (SPD).
The first part of the technical report, CIE 170-1, defines the 2° and 10° Modified CIE Colorimetric Observer and describes how to calculate the spectral cone sensitivities (cone fundamentals) for observers between 1° and 10° for different age groups. The cone fundamentals have been derived from a set of color-matching functions experimentally collected on a 10° field.
The second part, CIE 170-2, establishes a new approach to color specification by defining color‑matching functions directly on the cone response. The CIE 170-2:2015 cone‑fundamentals based CMFs represent an average observer and complement the existing standard colorimetric observers. As a technical report CIE 170 describes the “current state of art” and is intended to be used by the CIE membership and other interested parties. It is not intended as a substitute for the two standard colorimetric observers CIE 1931 and CIE 1964. The aim of CIE 170-2 is to establish a link between physiology and colorimetry. This modern CIE approach is supposed to improve the understanding of color. It is meant to be useful for education and offer novel opportunities of solving problems of color measurement.
Considerations for choosing which color-matching functions to use for which application
The CIE 170-2:2015 2° and 10° observer complement the existing CIE 1931 2° and CIE 1964 10° observer. Other suggestions for observers, which are supposed to improve the color-match for an average observer exist. Depending on the goal of a measurement and the actual application at hand one can choose the observer which fits (best) to the main criteria.
Compliance to a standard
The display industry relies on the color-matching functions for quality control purposes. By ensuring that colors are reproduced accurately based on established color-matching functions, companies can maintain consistency, compare their results and meet quality standards.
The CIE 1931 2° and CIE 1964 10° Standard Observers allow for uniformity in color science practices and applications. These standardized color-matching functions provide a common reference point for color calculations, color space definitions, and color-related research.
When the compliance to a specific standard is needed, the relevant observer must to be used. For display applications this will normally be the CIE 1931 2° observer, like for example specified in the ICDM Information Display Measurement Standard (IDMS) or the DFF Display Measurement
Specification.
2° vs 10° observer
The 10° observer is not inherently better than the 2° observer or vice versa. In an ideal-world-scenario one would match the observer to the viewing angle condition. For this reason CIE 170-1 introduces a modelling approach for observers between 1° and 10°. Due the lack of practicality it is typically not possible to use an observer for “every possible angle”. Even if one would decide to use a set of 10 observers to describe 1° up to 10° field of view, this still does not account for observer variations in age and optical variations of the individuals eyes.
Finally in many applications one will experience varying viewing angles. For example the content displayed on a TV will often show small colored details (e.g. leaves and branches in a tree), while at other times show larger color areas (e.g. large blue sky). Therefore one needs to define which viewing angle is deemed to be most typical or important. For display applications this will most likely be a smaller viewing angle and therefore the 2° observer is typically chosen. For other applications like car or house paints the 10° observer will be the better fit.
To illustrate the importance of using the matching observer based to the viewing angle let us have a look at the test data of color-matching experiments conducted by Yuta Asano in 2015. The data set was derived from a color-matching experiment with a viewing angle of 8.5°, so practically close to 10°. The plots below show five test colors. Each subplot displays the CIE a*b* plane, with a* being the red-green axes and b* the yellow-blue axes. Each gray circle in the plot represents how one person has seen a specific test color. A red cross marks the mean of all observers. A black cross marks how a CIE 1964 10° observer would see the test color and the green cross marks how the 1931 2° observer would see the test color.
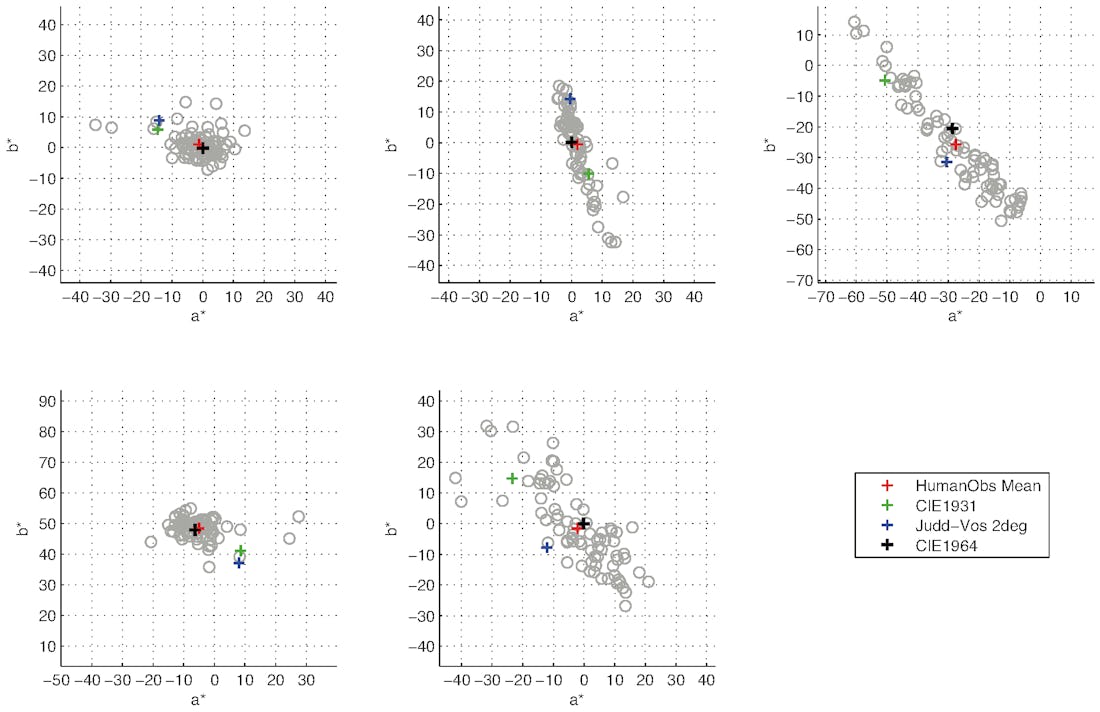
First it can be noted that the mean observer values (red cross) is very close to the 10° CIE 1964 observer (black cross). This is to be expected and is an indication that CIE 1964 really describes an average observer for the large viewing angle around 10°.
Second it shows that the CIE 1931 2° observer is relatively far away from CIE 1964. If this was not the case, defining two distinct observers for the small and large viewing field would not be necessary. That also makes it very clear that it is important to match the observer to the actual viewing field.
Finally the plots show also a significant variation in between the test participants. For three of the five test colors the spread between different observers is very large. This illustrates very clear that a single color-matching function cannot describe every individual observer accurately. Practically this also means that only a small number of observers will perceive a colorimetrically established color-match as similar. For two displays calibrated to the same target, a visual evaluation of the calibration result, done by a single person, will therefore not tell very much, because it is not known how close or far an individual observer is from the chosen standard observer, where the measurements are based on.
CIE 170 observer
CIE 170-1:2015 observer
CIE 170 introduces a set of color-matching functions and estimates of cone fundamentals for the normal observer, ranging in viewing angle from 1° to 10°. The age effects, which influence the absorption in the eye, can be taken into account additionally. To illustrate how large the influence of the age is on the color vision we will revisit the same color-matching experiment we looked at above. The following plots shows the same data as before, but this time color-coded to visualize the ages of the test participants.
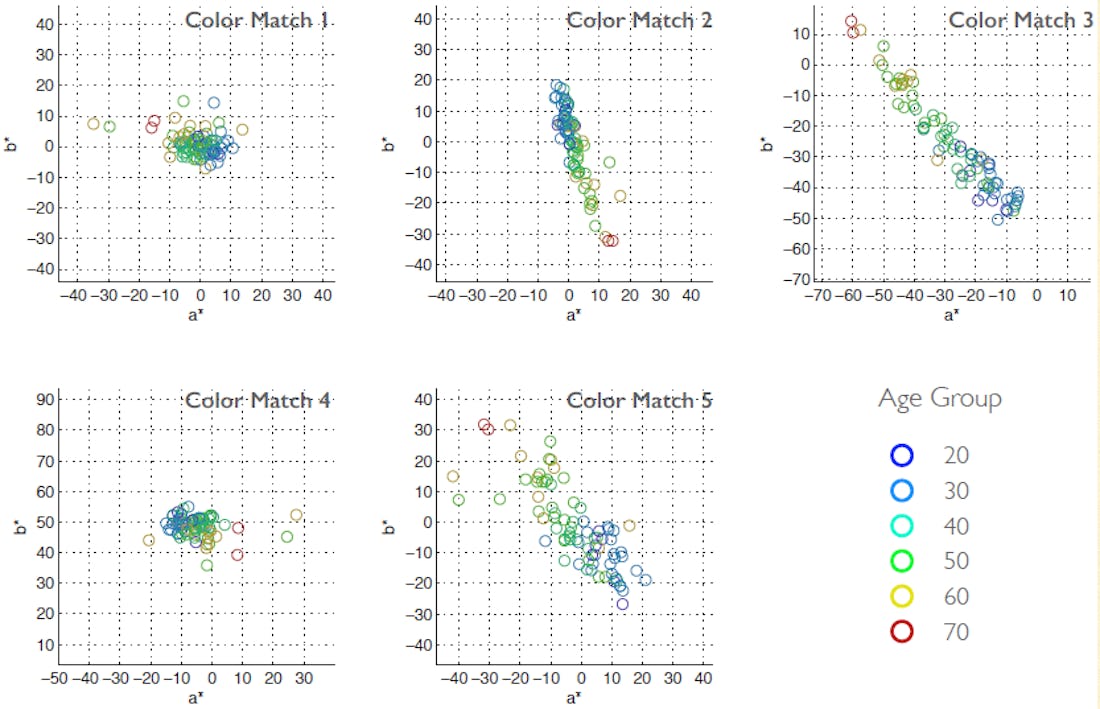
The ages of the test participants line up mostly in order, with not too much variation. This illustrates the significant impact of the observers age on the color vision.
Using the variety of modelled CIE 170-1 observers can be an interesting option, especially in color research, but they are mostly not practical for industrial applications, where one needs to decide on one specific (standard) observer.
CIE 170-2:2015 observer
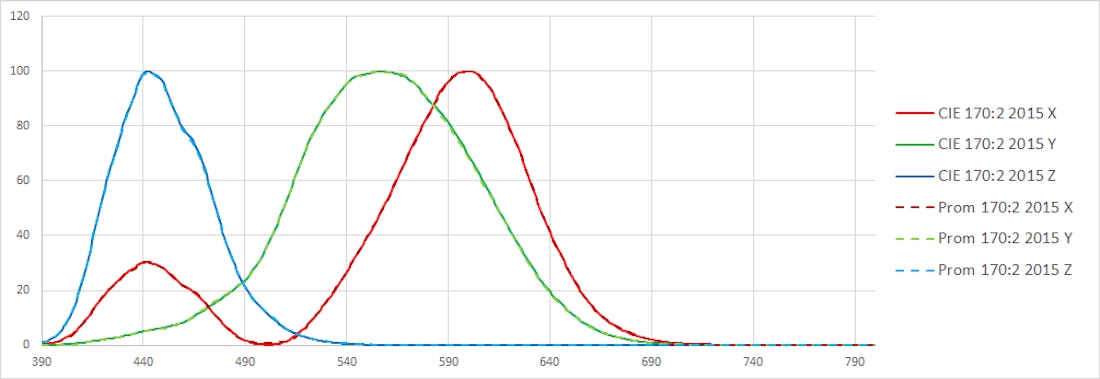
This is where the CIE 170-2 observers come into play. Like the CIE 170-1 observers they are based on cone-fundamentals, representing the most current data and color research. They represent an average 38 years old observer and are available as 2° and 10° observer. The considerations outlined above for which application to choose the 2° or 10° observer apply here as well.
Using the CIE 170-2 observer can be an interesting alternative to CIE 1931. Some companies already have used the CIE 170-2:2015 2° observer in recent years. When considering the use of a CIE 170-2 observer, it must be noted that all display standardization so far has been based on the CIE 1931 2° observer. That means a change to the CIE 170-2 observer will require to define new target values, e.g. for the white point. It also means that displays will look different compared to one calibrated to the CIE 1931 standard. That is the whole point of course to hope to get a better visual match for the average observer. But of course using the CIE 170-2 observer cannot solve observer metamerism. In the summary we will outline options to deal with that.
Other observers
Besides CIE 170 other suggestions for improved CMFs exist. One example are the ones suggested by Saski Polster. In her thesis she has shown that the CIE 170 CMFs does improve the visual match compared to CIE 1931 and CIE 1964, but possibly can still be improved. She suggested a modified set of 2° and 10° CMFs, based on the cone-fundamentals in CIE 170. For her experimental data set this further improved the visual matches.
Summary and practical measurement implementations
We can conclude that color science has went a long way and we have a good understanding of how the human vision works. Modelling the color vision of an average observer allows us to achieve predictable colors in typical applications.
On the other hand, standardizing colorimetry using a single observer color-matching function, cannot account for different viewing conditions such as different viewing fields. Nor can it account for the existing variation in the color perception of the population. Also the color perception changing with an observers age is not reflected by standard colorimetry used today.
Using the CIE 1931 2° or CIE 1964 10° standard observer as the basis for colorimetry works reasonably well for many practical applications. This is especially true for reflected colors, which will have a relative smooth spectral power distribution. For display applications, especially when modern wide-gamut displays come into play, the influence of the observer variation in the population can pose challenges to achieve a satisfactory visual match by standard colorimetry. The higher sensitivity to variations in the individual observers spectral sensitivities is a side effect of narrow spectral peaks of the display primaries (normally red, green, blue), needed to realize the most vivid and saturated colors in a wide-gamut display.
Using the CIE 170-2:2015 2° or 10° observer can be an interesting approach in the aim of realizing a somewhat improved colorimetry for the average observer, 38 years of age. Deciding between the 2° and 10° observer should always be based on the typical viewing field of the application and take into account if small details need to be discerned. It is also important to consider if compliance to existing standards, such as ICDM or DFF standards, is needed. If that is the case one must choose the relevant observer. For display standards this is currently the CIE 1931 2° observer.
Dealing with observer metamerism
There are several approaches possible to deal with the diversity of different individual observers color vision.
The first important approach is to minimize the practically observed metamerism in the display design phase by choosing the spectra of the three display primaries wisely (see references). This is possible, because different spectral stimuli can lead to the same perceived color. A further improved solution can involve the use of more than three primaries – a multi-primary display (see references).
The second approach is by realizing a custom color-match for an individual. That is a valid option, but has the big drawback that it will be valid only for one person. So it cannot be applied in situations where several people will view a display at the same time! Accounting for the individual persons color perception can be done in two ways.
One is to visually correct for color mismatches after a colorimetric, means measured, color match and measure this offset for future reference. This is a practical approach in some TV calibration software suites for example. They can differ in the details, but the basic idea is to manually adjust the displayed content and correlate or incorporate that in someway with the colorimetric measurements. This approach can work quite well, but is hard to standardize the output objectively.
Finally another option to account for the individual observer would be to determine the color‑matching-functions of each person. This is a laborious and therefore costly procedure and will normally not be practical. But another option for a better single observer color match is to offer a set of predefined color-matching functions to categorize people into groups with similar color vision. This can be seen very much like offering a shirt in several sizes and not only a single one‑size‑must‑fit‑all shirt. Mark Fairchild and Yuta Asano suggested that a set of 10 categorical observers would already be a good fit for general use, while on the other hand 50 categorical observers would be required to predict individual observers’ matches accurately for laser projectors, which show very sharp peaks for their primaries. This approach is much more practical and could be standardized as well.
Measuring for different standard observers with Admesy Prometheus
Measurement with a specific observer color-matching function can be either realized with a filtered colorimeter or by means of using a spectroradiometer. In the Admesy Prometheus spotmeter series both colorimeters and spectroradiometers are available.
Admesy Prometheus 색차계
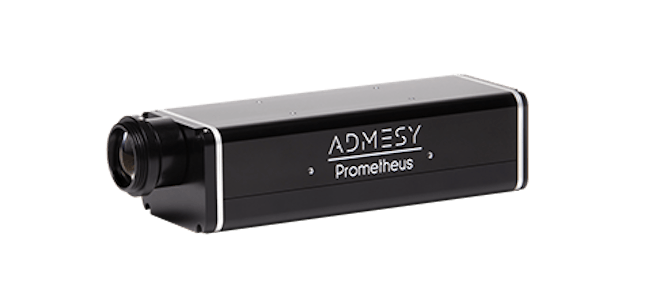
The Prometheus colorimeter utilize our in-house made filters, which realize the lowest possible f1’ spectral mismatch. The f1’ number describes how good the fit of a filter curve is to the target. Admesy offers the Prometheus colorimeters with the color filters matching to the observer of your choice. Currently CIE 1931 2° and CIE 170-2:2015 2° and 10° observers are offered. The accurate Prometheus colorimeters are exceptionally fast at the same time. They are the best solution for high-volume production where reliability and speed are equally important.
Admesy Prometheus 분광 복사계
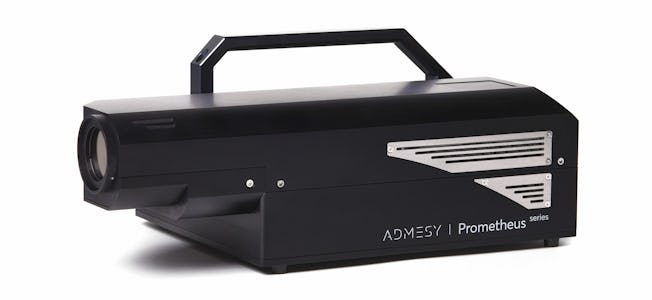
With a Prometheus spectroradiometer the color tristimulus values can be calculated for any color‑matching function. So it is possible to measure the tristimulus values for different observers at the same time, by acquiring a single spectral power distribution (SPD). This versatility is one of the advantages of a spectroradiometer.
"The Prometheus Viewfinder Spectrometer stands out because it of the high accuracy and fine wavelength resolution."
To calculate the CIE 170-2 cone-fundamental-based tristimulus values the wavelength range between 390 nm and 830 nm is integrated. This is in contrast to the CIE 1931 and CIE 1964 standard observers which are defined for the wavelength range between 380 nm and 780 nm. The Prometheus Viewfinder Spectrometer stands out because it covers an extended wavelength range of 360 nm to 830 nm, which is a wider range than other display spectrometers. This means it can accurately measure colors according to the CIE 1931, CIE 1964 and CIE 170-2:2015 2° and 10° observers.
The Prometheus Viewfinder Spectrometer’s versatility is further enhanced by its adjustable measurement angles. This allows you to precisely control the angle at which you measure the light. This is not to be confused with how the captured spectral power distribution is weighted for a given observer angle (2° or 10°) to calculate the tristimulus values. For example at a measurement angle of 1°, you can read out the XYZ tristimulus values for all four standard observers mentioned above!
Combined with the highest accuracy possible, this makes the Prometheus Viewfinder Spectrometer the ideal tool for any demanding display measurement application.
Links and References
A Beginners guide to colorimetry
Asano Y, Fairchild MD., Categorical observers for metamerism. Color ResAppl. 2020;1–10
CIE 1931 colour-matching functions, 2 degree observer
DFF - Specifications & Technical Documents
Emulating the Wright-Guild experiment
How the CIE 1931 color-matching functions were derived from Wright-Guild data
IDMS – Information Display Measurement Standard
ISO 11664-1:2007(E)/CIE S 014-1/E:2006
Optimizing Spectral Color Reproduction in Multiprimary Digital Projection
Observer metamerism in commercial displays
Le Moan et al, An observer-metamerism sensitivity index for electronic displays, Journal of the SID, 2017

