Spectral data
A wide range of applications in product development or inline production demand highly accurate analysis of light or reflection of light. Analysis by means of luminance measurements and tristimulus colorimeters may not always reveal all required information. Spectrometry, sometimes known as spectroscopy, allows detailed data regarding the composition of light per wavelength.
By dispersing a light beam via a prism or grating, the amount of energy at individual wavelengths can be measured. Spectral information can for example be used to determine spectral power distribution, presence of undesired wavelengths, color rendering properties of light sources or for transmissive or reflective properties of materials.
This is generally considered as regular spectrometry. Spectrometry can be described as the study that focuses on the analysis of light by dispersing light beams into individual wavelengths. This analysis is typically done with a spectrometer: an instrument which is capable of determining the composition of light.
By dispersing the incoming light via a grating into individual wavelengths, the proportions of each wavelength can be measured. Besides the visual range [VIS], which can be seen by the human eye, Admesy also offers products measuring from ultraviolet [UV] to Near-infrared [NIR]. The picture below shows an overview of different wavelengths.
One example for spectral measurements is the assessment of light. Light analysis by means of spectrometers is typically expressed in spectral graphs which represent the spectral power distribution. The picture below shows the spectral power distribution of several “white” Light sources using a calibrated spectroradiometer.
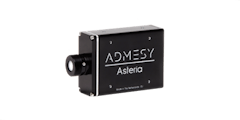
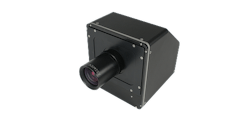
Admesy offers spectroradiometers each serving specific needs for in the product development stage or for process control, for example in inline measurements. The table below gives an overview of different parameters and corresponding measurement devices. These applications do not only cover display and lighting measurements, but also transmission and reflection measurements and analytical applications.
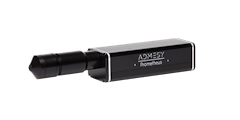
| Neo | Prometheus Spectrometer | |
|---|---|---|
| Analytical | yes | |
| Color analysis | yes | yes |
| Dominant & Peak wavelength | yes | yes |
| Luminance & Illuminance | yes | Luminance |
| Luminous intensity | Cosine Corrector | |
| Luminous flux | Combined with sphere | |
| CCT | yes | yes |
| CRI | yes | |
| PAR | Cosine corrector | |
| Low luminance | yes | yes |
How are you measuring?
With fibers and other accessories even more type of measurements are possible. Often used accessories are integrating spheres, cuvettes for fluids, light sources or filter holders.
A cosine corrector collects the light from the half space under 180 degrees. A typical application is the illuminance measurement of a lighting situation.
Consumers are used to enjoy top-quality displays in their mobile phones, tablets, laptops and even cars. Emerging technologies such as lighting surfaces for office and home illumination are expected to look equally perfect. Both displays and luminous surfaces are the main application areas for imaging colorimeters.
Measuring the luminance or color values at a specific location of the device under test is a typical use case when measuring displays. It can, however, also be meaningful to assess reflected light.
PCM2X-271

0.000 025 - 30 000 cd/m²
PCM2X-270
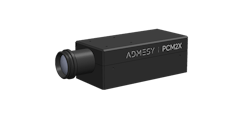
0.000 05 - 60 000 cd/m²
PCM2-100
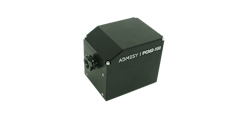
0.0003 - 15 000 cd/m²
PCM2X-102

0.000 05 - 60 000 cd/m²
Viewfinder Spectrometer

Standard lens 1.2° spot ⌀ 4.56 mm ‑ 6.71 m
Viewfinder Spectrometer

Close up lens 0.75° spot ⌀ 0.96 ‑ 1.47 mm
Colorimeter 2.1 mm
0.001 - 30 000 cd/m²
Colorimeter 5 mm

0.001 - 30 000 cd/m²
Colorimeter 10 mm

0.001 - 30 000 cd/m²
Colorimeter 10 mm wide-angle

0.000 3 - 7 500 cd/m²
Colorimeter 20 mm

0.0003 - 7 500 cd/m²
Colorimeter 27 mm wide-angle

0.0001 - 2 800 cd/m²
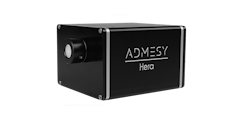
Spectrometer
VIS 380 - 780 nm
High-End Spectrometer

VIS 360 - 940 nm

